Data Visualisation
Transforming Data into Vision
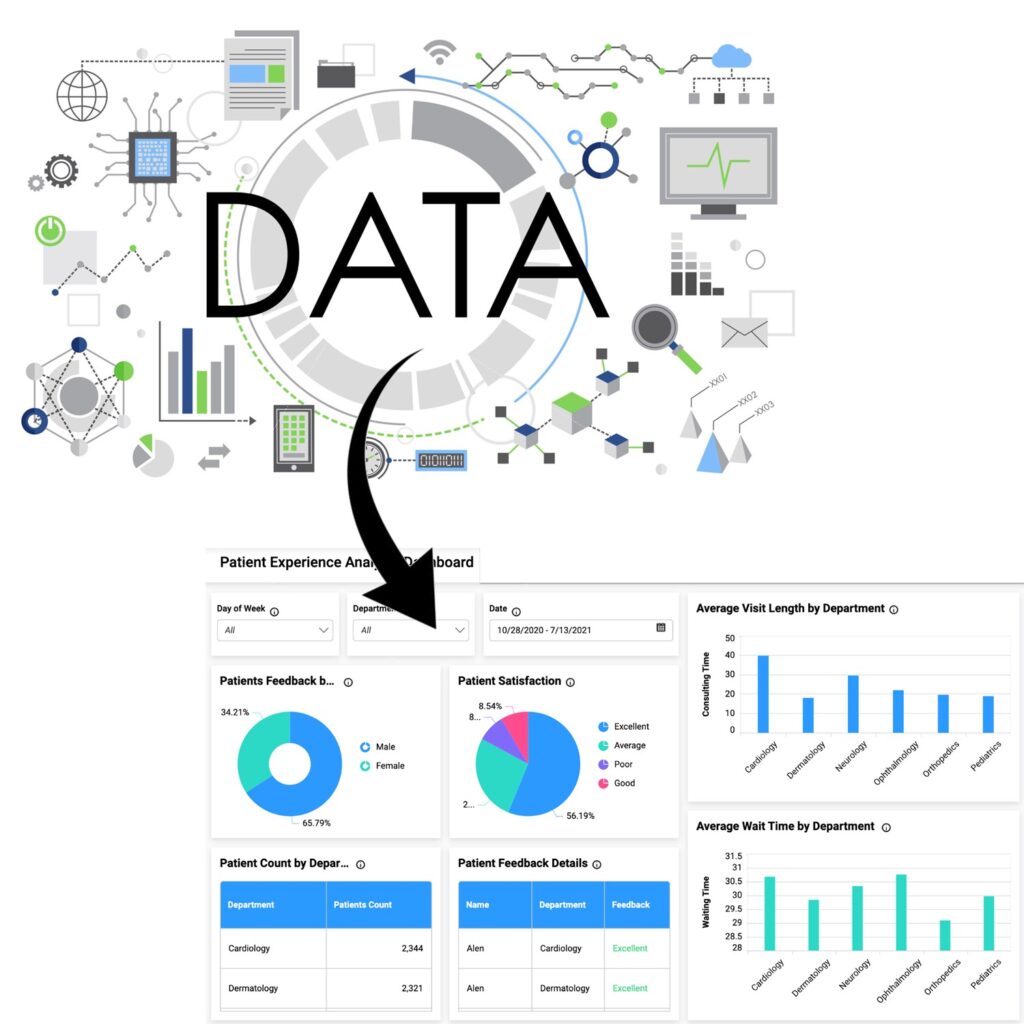
From Data to Visualisation
In medical research, data visualisation bridges the gap between complex statistical outcomes and meaningful insights, providing clarity and impact to your audience. Our expertise lies in creating compelling visual representations of your data, including publication-ready tables, charts, and infographics that are scientifically accurate and aesthetically refined.
Understanding Through Visual Clarity
We design visuals beyond mere presentation, ensuring they tell the story behind your data with precision and clarity. Our tailored visualisations are crafted to suit your study’s objectives. Each element is optimised for readability and professional presentation, making your findings accessible to both expert and non-expert audiences.
Publication and Presentation
Our data visualisation services adhere to the highest standards required for academic journals, conferences, and stakeholder communications. By combining statistical rigour with creative design, we ensure your visual outputs not only meet but exceed expectations.
Contact us today to discover our data visualisation expertise.